
Complex research needs understandable digital systems.
Scientific UX, data visualization, knowledge systems, AI workflows and digital platforms for research, innovation and technology-driven organizations.
The core problem
Complexity often grows faster than understandability. Research produces datasets, reports, dashboards, documents, models, project knowledge, monitoring streams and stakeholder information. The challenge is rarely collecting it — it is turning it into orientation.
- Datasets, models and monitoring streams nobody fully oversees.
- Knowledge scattered across documents and tools instead of being usable.
- Results that must be communicated — to stakeholders, boards, the public.
From data to decisions
- Understand
- Structure
- Design
- Implement
- Validate
- Decide
What this produces
Information load becomes orientation, visible relationships, earlier-recognizable risks, stronger understanding and long-term usable knowledge — the basis for decision confidence.
- Orientation instead of losing the overview.
- Visible relationships and earlier-recognizable risks.
- Knowledge that stays usable beyond the project's end.
Possible outputs
Challenge
- Datasets without an understandable surface
- Knowledge that cannot be found
- Monitoring without a link to action
- Results that are hard to communicate
- Manual, repetitive evaluation work
Possible outputs
- Research dashboard and scientific data interfaces
- Knowledge platform and project portal
- Interactive demonstrator and dissemination platform
- Monitoring & reporting system, geospatial interfaces
- AI-supported research workflow and decision-support UI
Competence areas
Scientific UX
Understandability for complex information environments — information architecture that unites domain depth and orientation.
Data visualization & analysis
Presenting large and complex datasets so that patterns, relationships and risks become visible.
Knowledge systems
Structuring distributed project and domain knowledge, making it findable and usable beyond the project.
AI & automation
AI-supported workflows and automation for evaluation, monitoring and recurring analysis.
Digital platforms
Research dashboards, project portals, demonstrators and dissemination platforms — from concept to a working system.
Cooperation models
Project-based
A scoped initiative from structure to a working result.
Work package / implementation partner
As an external implementation partner for a clearly defined work package — scope and role agreed together.
Sprint
Focused capacity for a single phase or a prototype.
Long-term
Recurring collaboration across the lifetime of a program.
Related services
Qualitative & Heuristic UX Audit
A UX audit systematically evaluates a digital product using established usability heuristics, psychological principles, and real-world usage contexts.
Content & Information Architecture Analysis
This analysis examines how content is structured, labeled, and discoverable.
Data Validation & Quality Assurance
Validation checks completeness, consistency, plausibility, and reproducibility of collected data.
Accessibility Audit (WCAG 2.1+)
An accessibility audit evaluates digital products against WCAG 2.1+ standards across visual, motor, cognitive, and technical dimensions.
Product & Platform Analysis
This analysis treats the product not as an isolated artifact, but as a coherent system of goals, user groups, features, technical constraints, and organizational dependencies.
Roadmapping & Decision Logic
This module designs roadmaps as learning systems that adapt to evidence instead of ignoring it.
Selected work
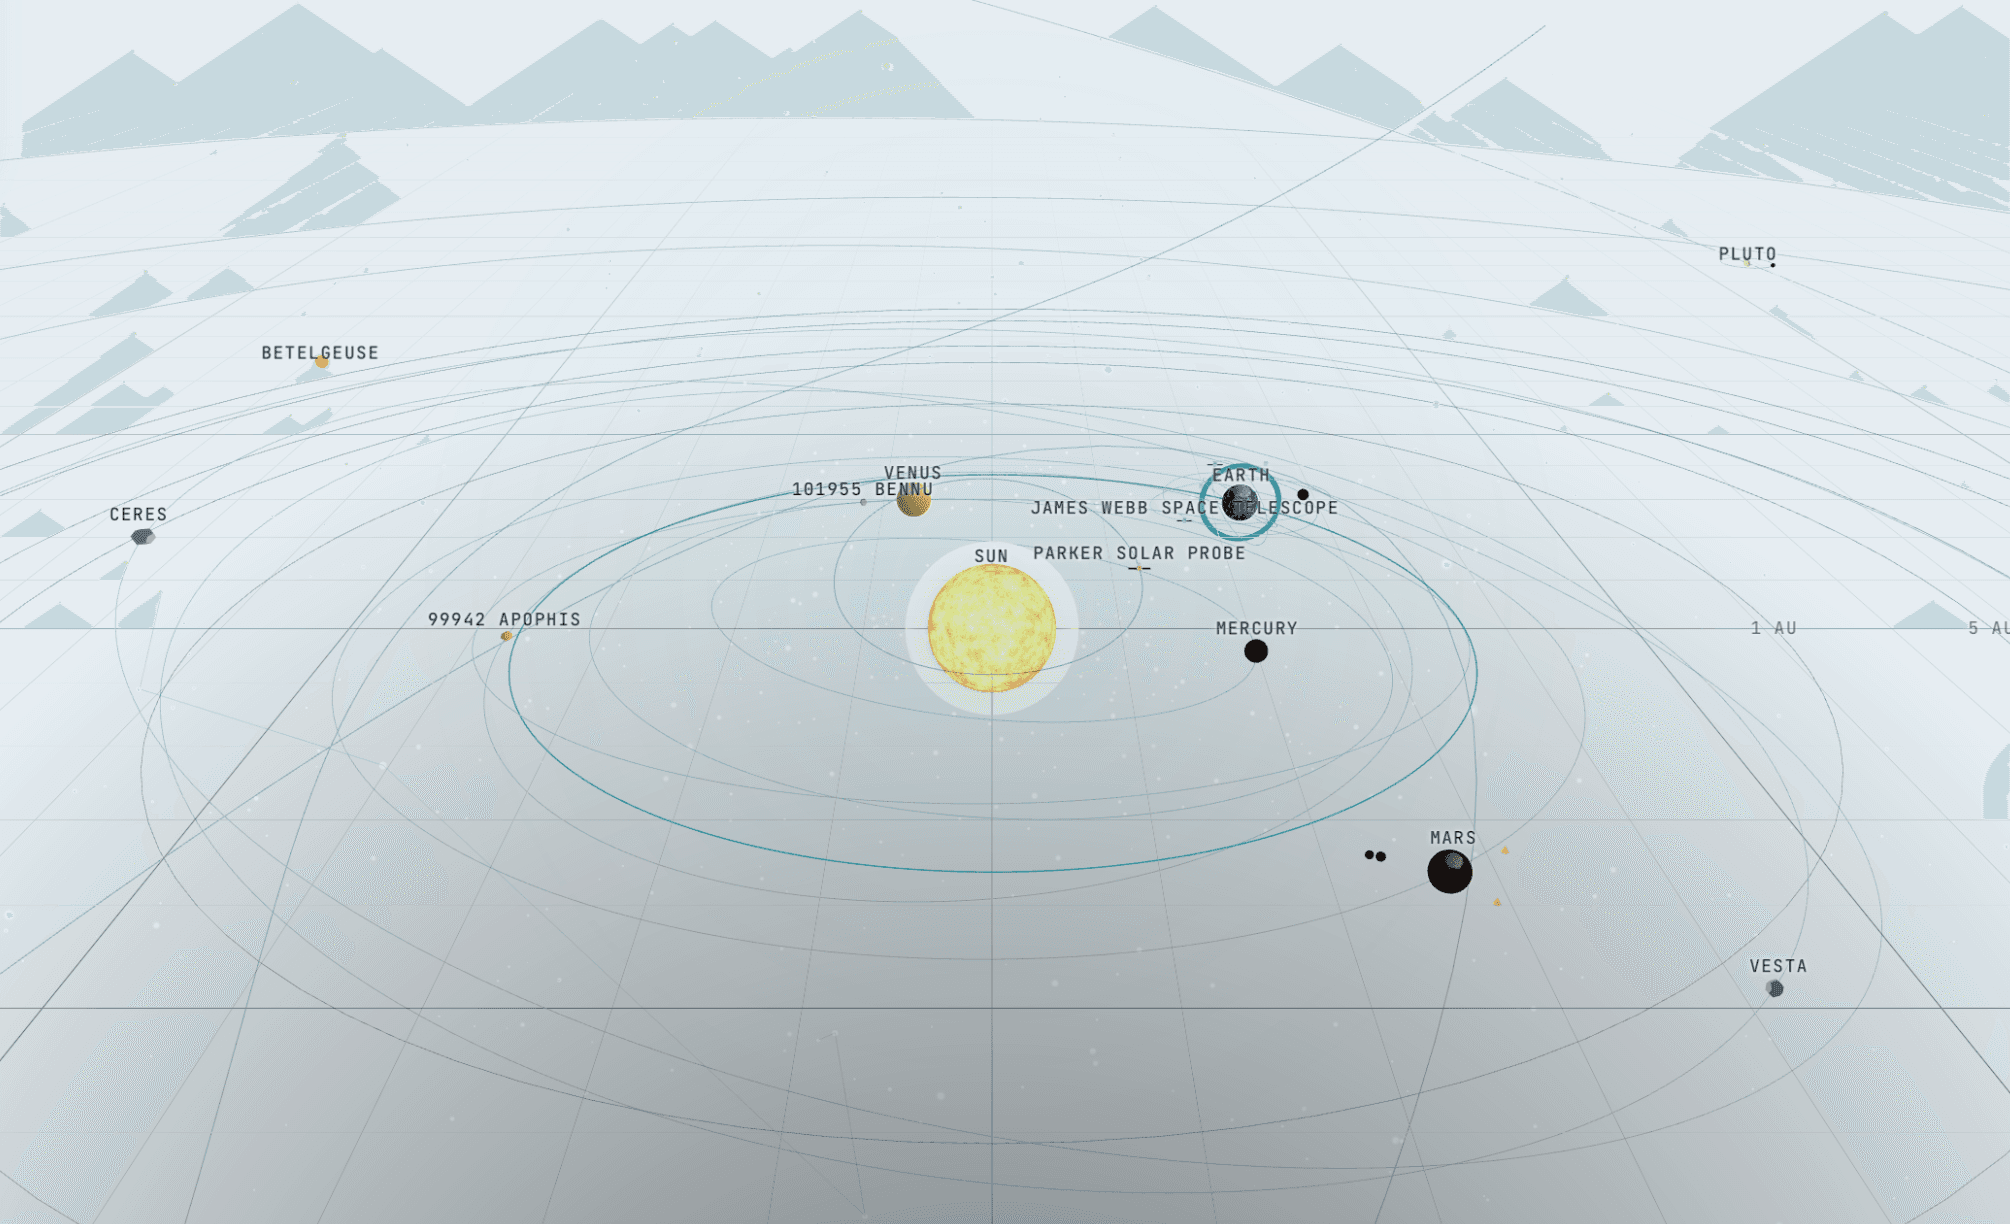
Planetary Observation OS
Planetary Observation OS is an interactive platform for exploring the universe.

Sixfold OS
The operating system for product maturity.
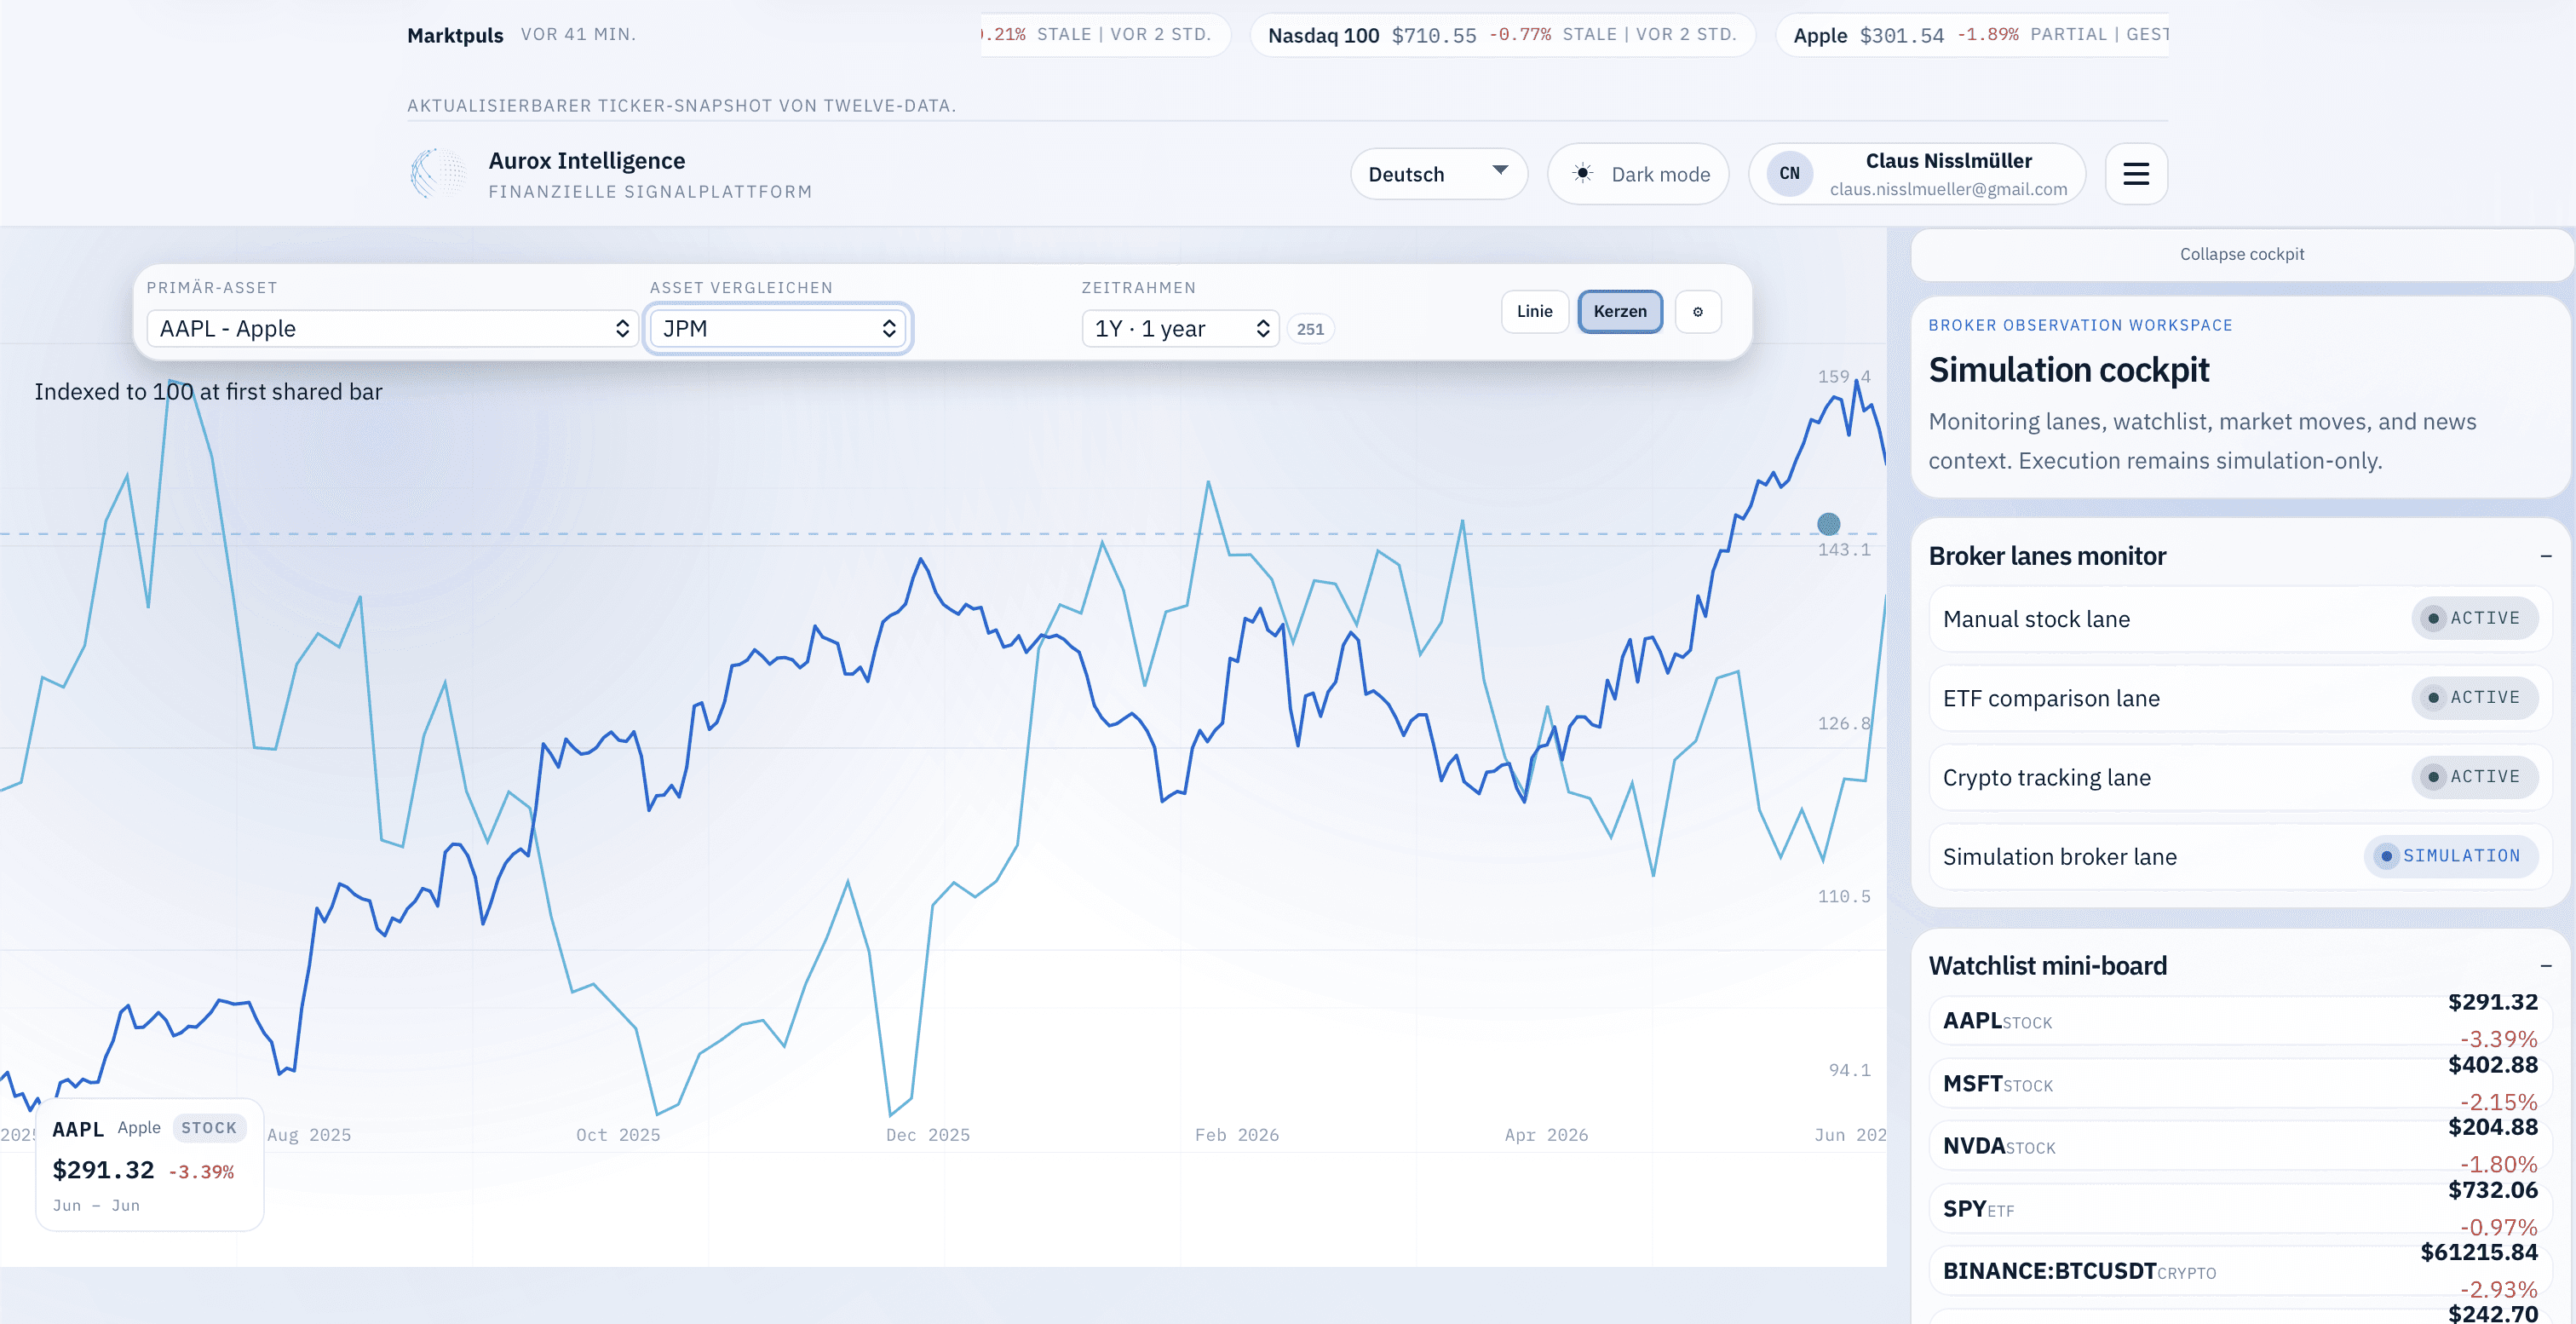
Aurox Intelligence
Simulation-first Financial Intelligence for Transparent Decision Making.
Second Life NGO
The project encompassed the redesign and implementation of a modular website infrastructure and governance.
How collaboration works
- 01
Understand
Capture the data, users, question and context of the initiative.
- 02
Structure
Order the information architecture and data logic.
- 03
Design
Design interfaces and visualizations that make complexity legible.
- 04
Implement
Build the system as a working platform, dashboard or demonstrator.
- 05
Validate
Test and sharpen with real data and users.
- 06
Hand over
Documented handover, so knowledge and system hold long-term.
Direct answers
Scientific UX makes complex, domain-dense information environments understandable and usable — information architecture, interaction and visualization for research, rather than generic marketing surfaces.
Yes. Mitterberger:Lab can contribute as an external implementation partner for a work package. Scope and role are agreed per project — this does not replace formal program or funding advice.
Yes. Research dashboards, scientific data interfaces and monitoring views are core work — from structure to a working system.
Yes. Data visualization and analysis is a competence area: presenting large, complex datasets so patterns and risks become legible.
In principle yes — as an implementation partner for a defined work package. Whether and how that is contractually possible depends on the specific project and its rules, and is clarified together.
Yes. Interactive demonstrators and dissemination platforms make results tangible — for boards, stakeholders and the public.